Does Luke turn to the Dark Side?

Does Luke turn to the Dark Side?

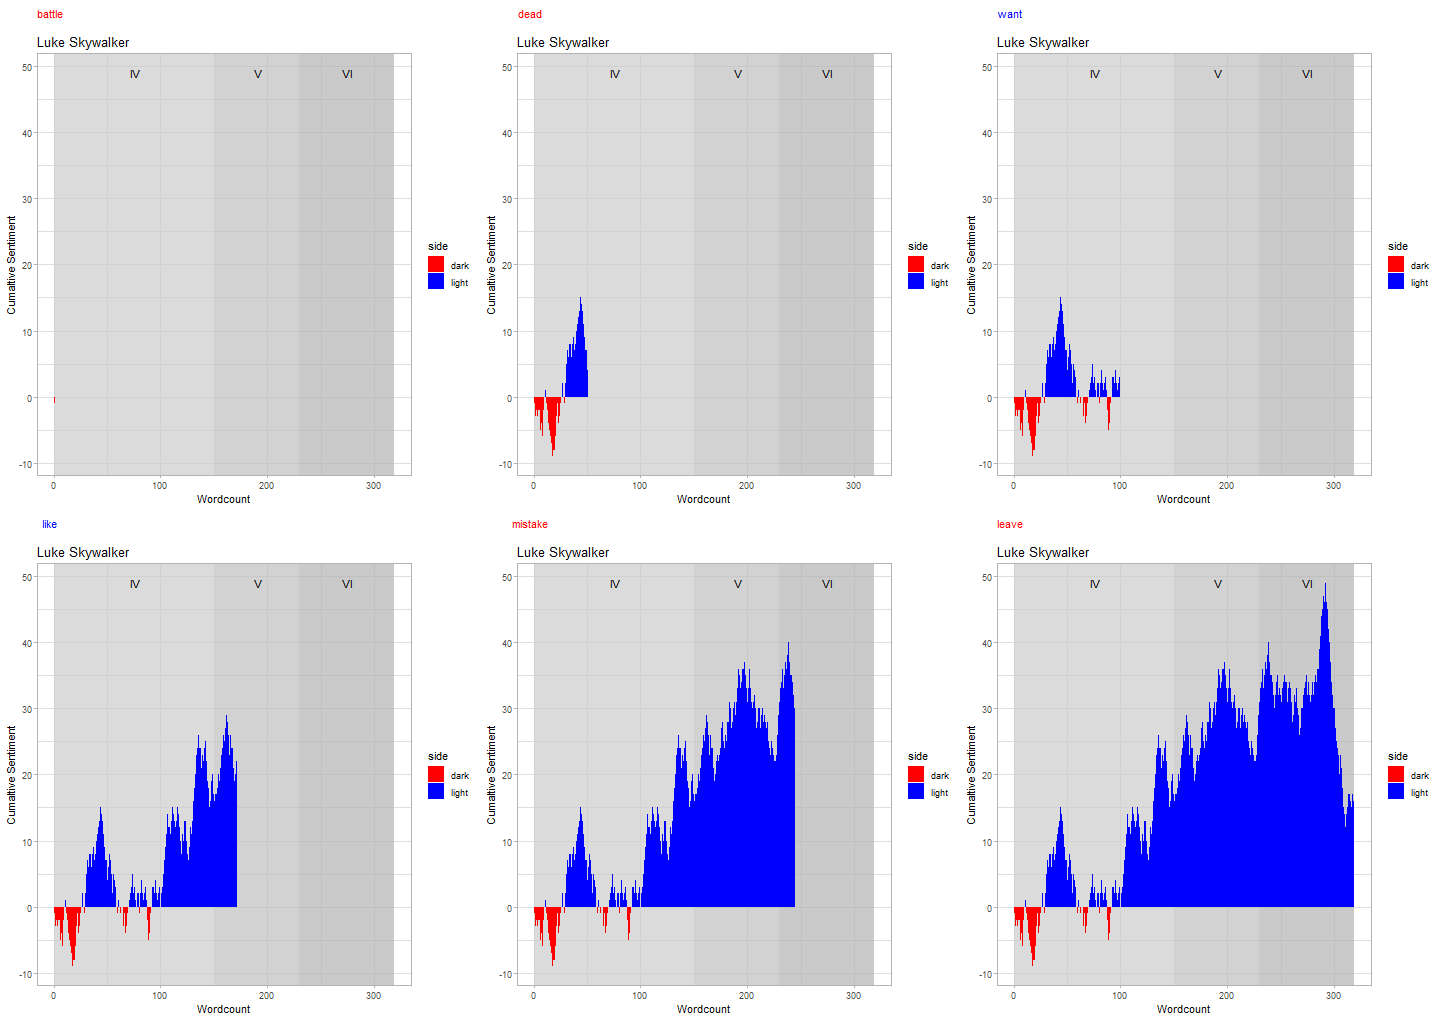
A few weeks ago I attended a text analytics hackathon, that was immensely enjoyable. Text analysis is something that is quite far from my average day job and I really enjoyed picking up some new skills and playing with the tidytext package. If you are looking to dive into text analytics, I thoroughly recommend the brilliant Text Mining with R book by Julia Silge and David Robinson. The data we experimented with at the event was the three scripts from THE Star Wars Trilogy (you know which one I mean) and I was keen to see if we could use sentiment analysis to distinguish whether a character was from the Light or Dark side.
Interactive Hierarchies - Drowning in rats

Interactive Hierarchies - Drowning in rats

It’s been a while since my last blog (turns out moving both job and city requires some effort), but for my glorious return I’ve decided to dive into the world of interactive graphics. In particular I’m going to investigate some alternatives packages that allow us to visualise hierarchical data. Interactive visualisations within R can be created using htmlwidgets. This specific set of packages brings the a host of interactive JavaScript visualisation libraries to R, without the user needing any prior JavaScript knowledge.
Writing an R package from scratch

Writing an R package from scratch

Anyone who has created their own R package has probably come across Hilary Parker’s awesome blogpost, that walks you through creating your very first R package. The comprehensive detail on everything R packages can be found in Hadley Wickham’s superb book. In this post I am going to walk through some of the developments in the package development space since Hilary wrote her blog four years ago, in particular focussing on the relatively recent usethis package.
Reanimating the Datasaurus

Reanimating the Datasaurus

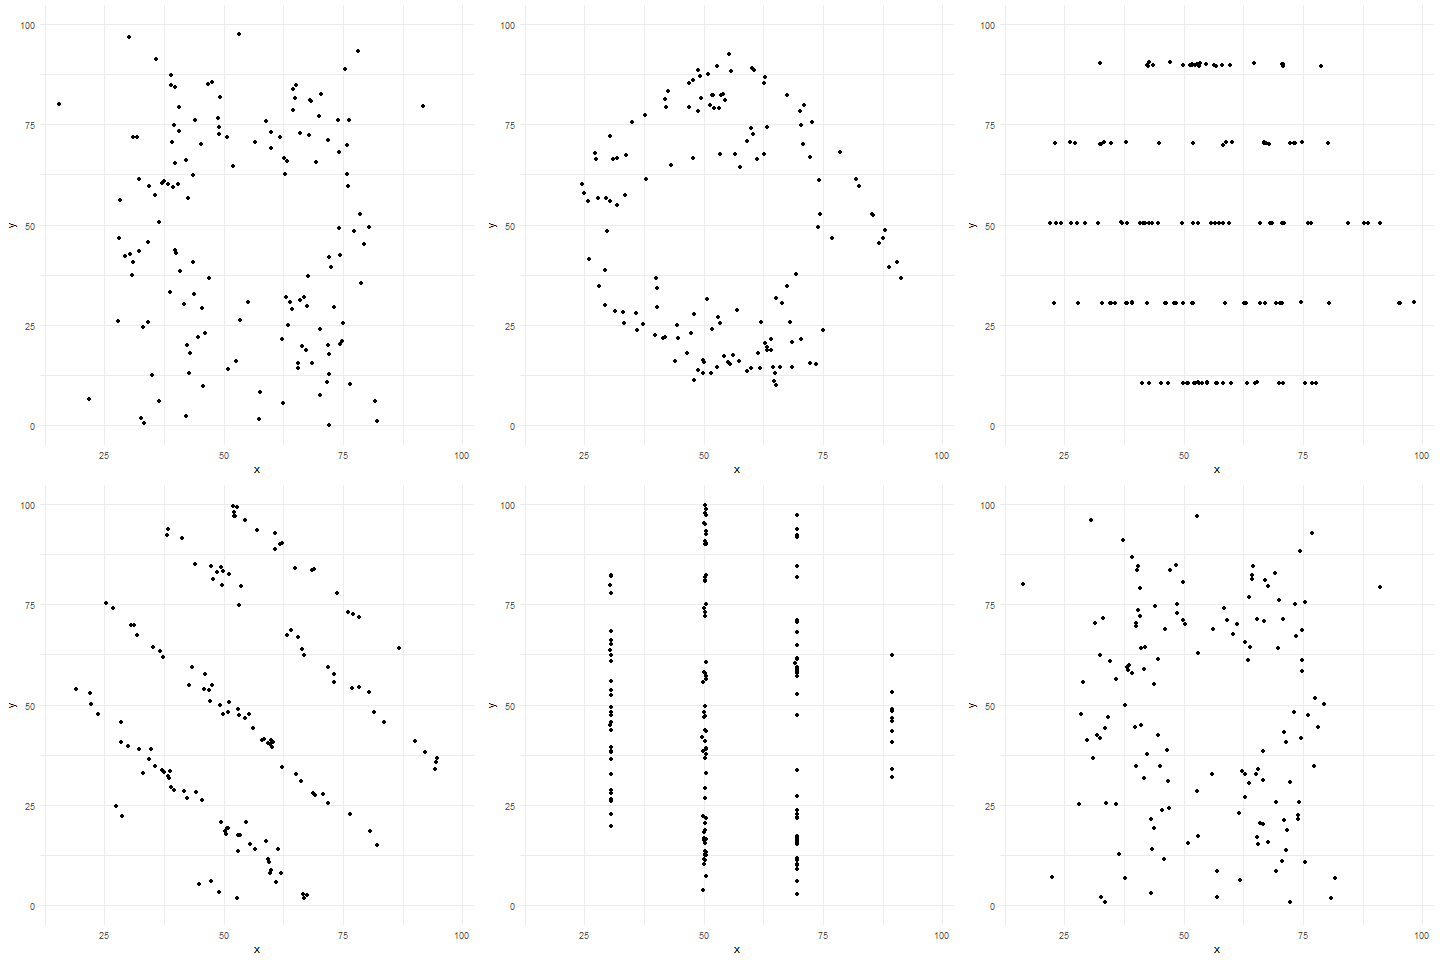
Whilst browsing twitter last night I came upon this tweet by the currrent author of gganimate: I've started a gganimate wiki page in order to collect examples. If you want to showcase your animations and help others learn in the process, consider submitting an issue as described on the main page #rstats https://t.co/VrT5IV2izr — Thomas Lin Pedersen (@thomasp85) August 16, 2018 Now I’ve been experimenting a lot with creating animations with R, and I absolutely love using gganimate .
The Burger King Pandemic

The Burger King Pandemic

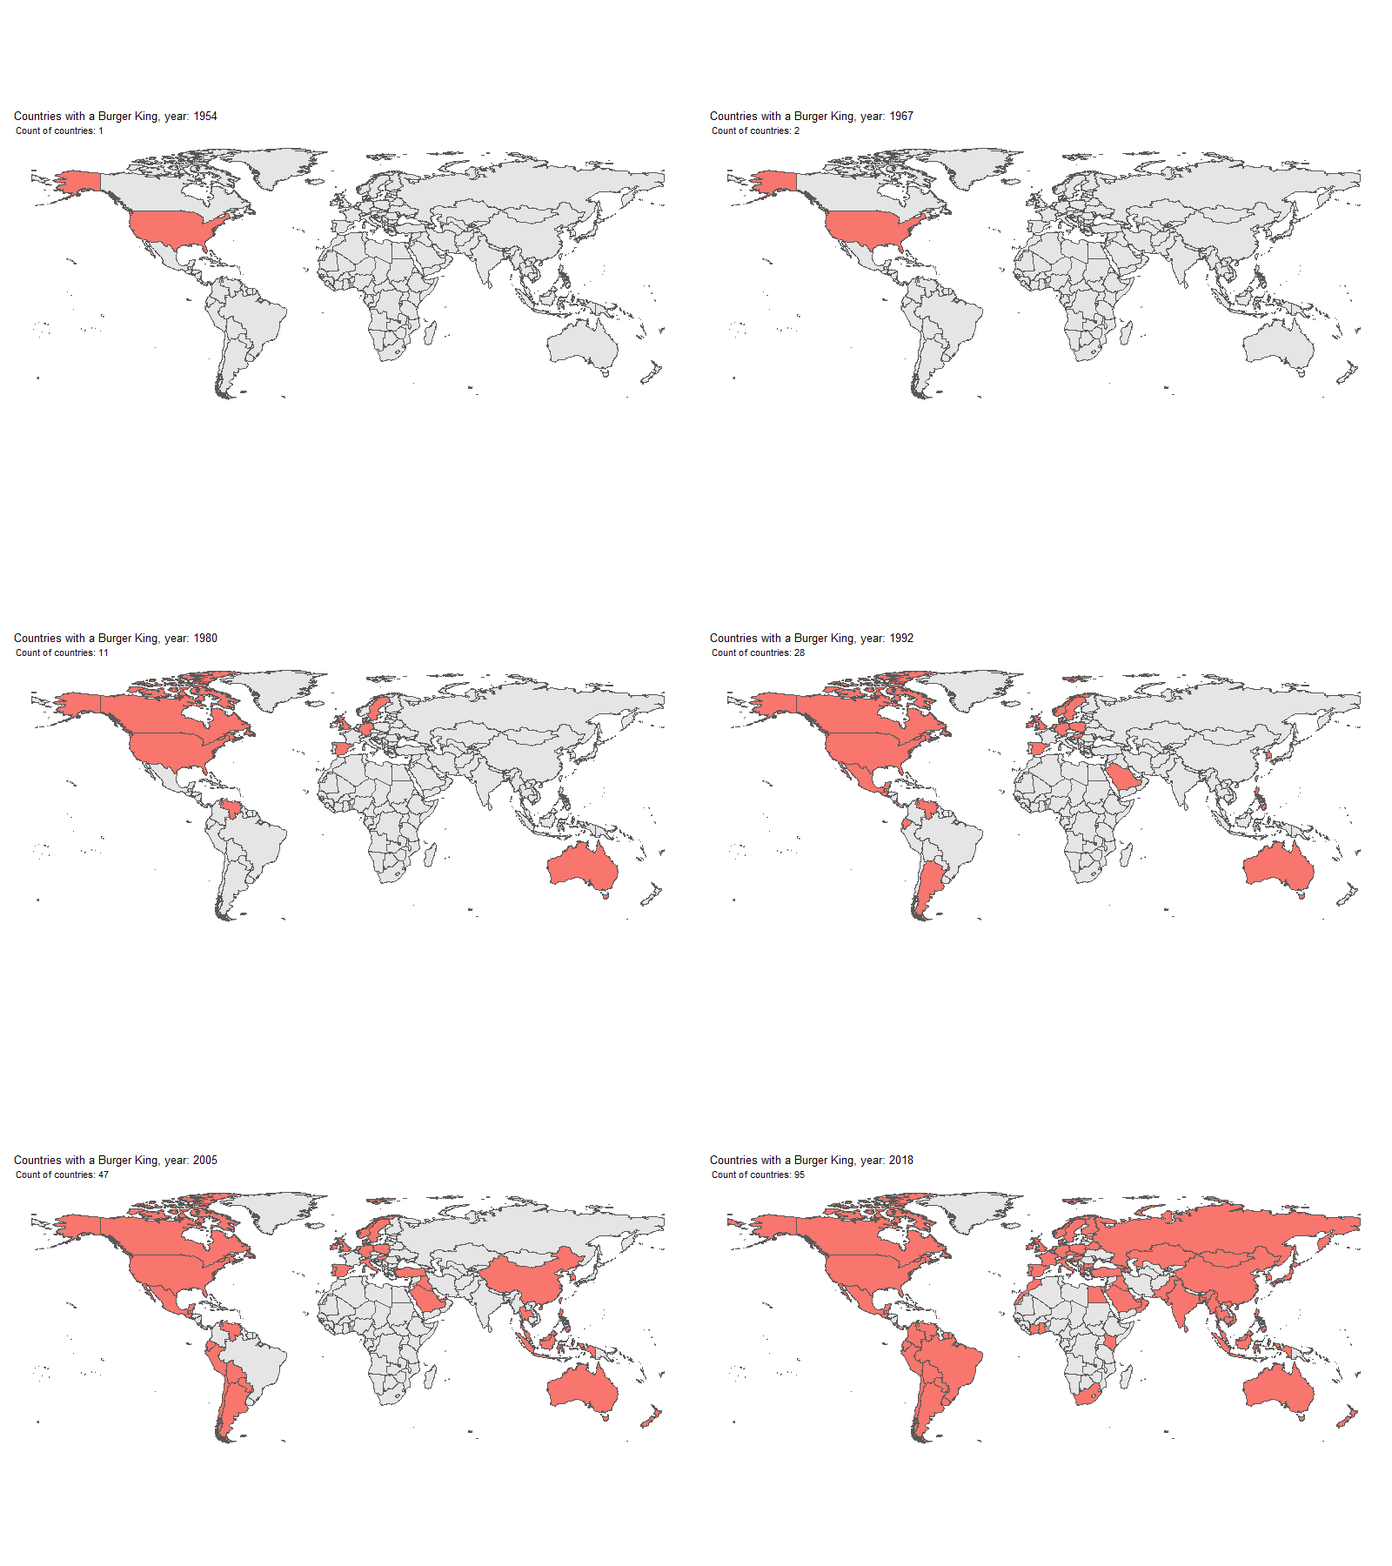
Whilst I was rooting around for inspiration, my girlfriend suggested I should do a post about food, quickly followed up by “burgers!!!”. So a few google searches later and I decided to create an animated map, showing all the countries of the world that had at least one Burger King store. I’m particularly chuffed that I’ve managed to combine a multitude of really cool packages in this post. We’ve got:
UK Population Pyramid

UK Population Pyramid

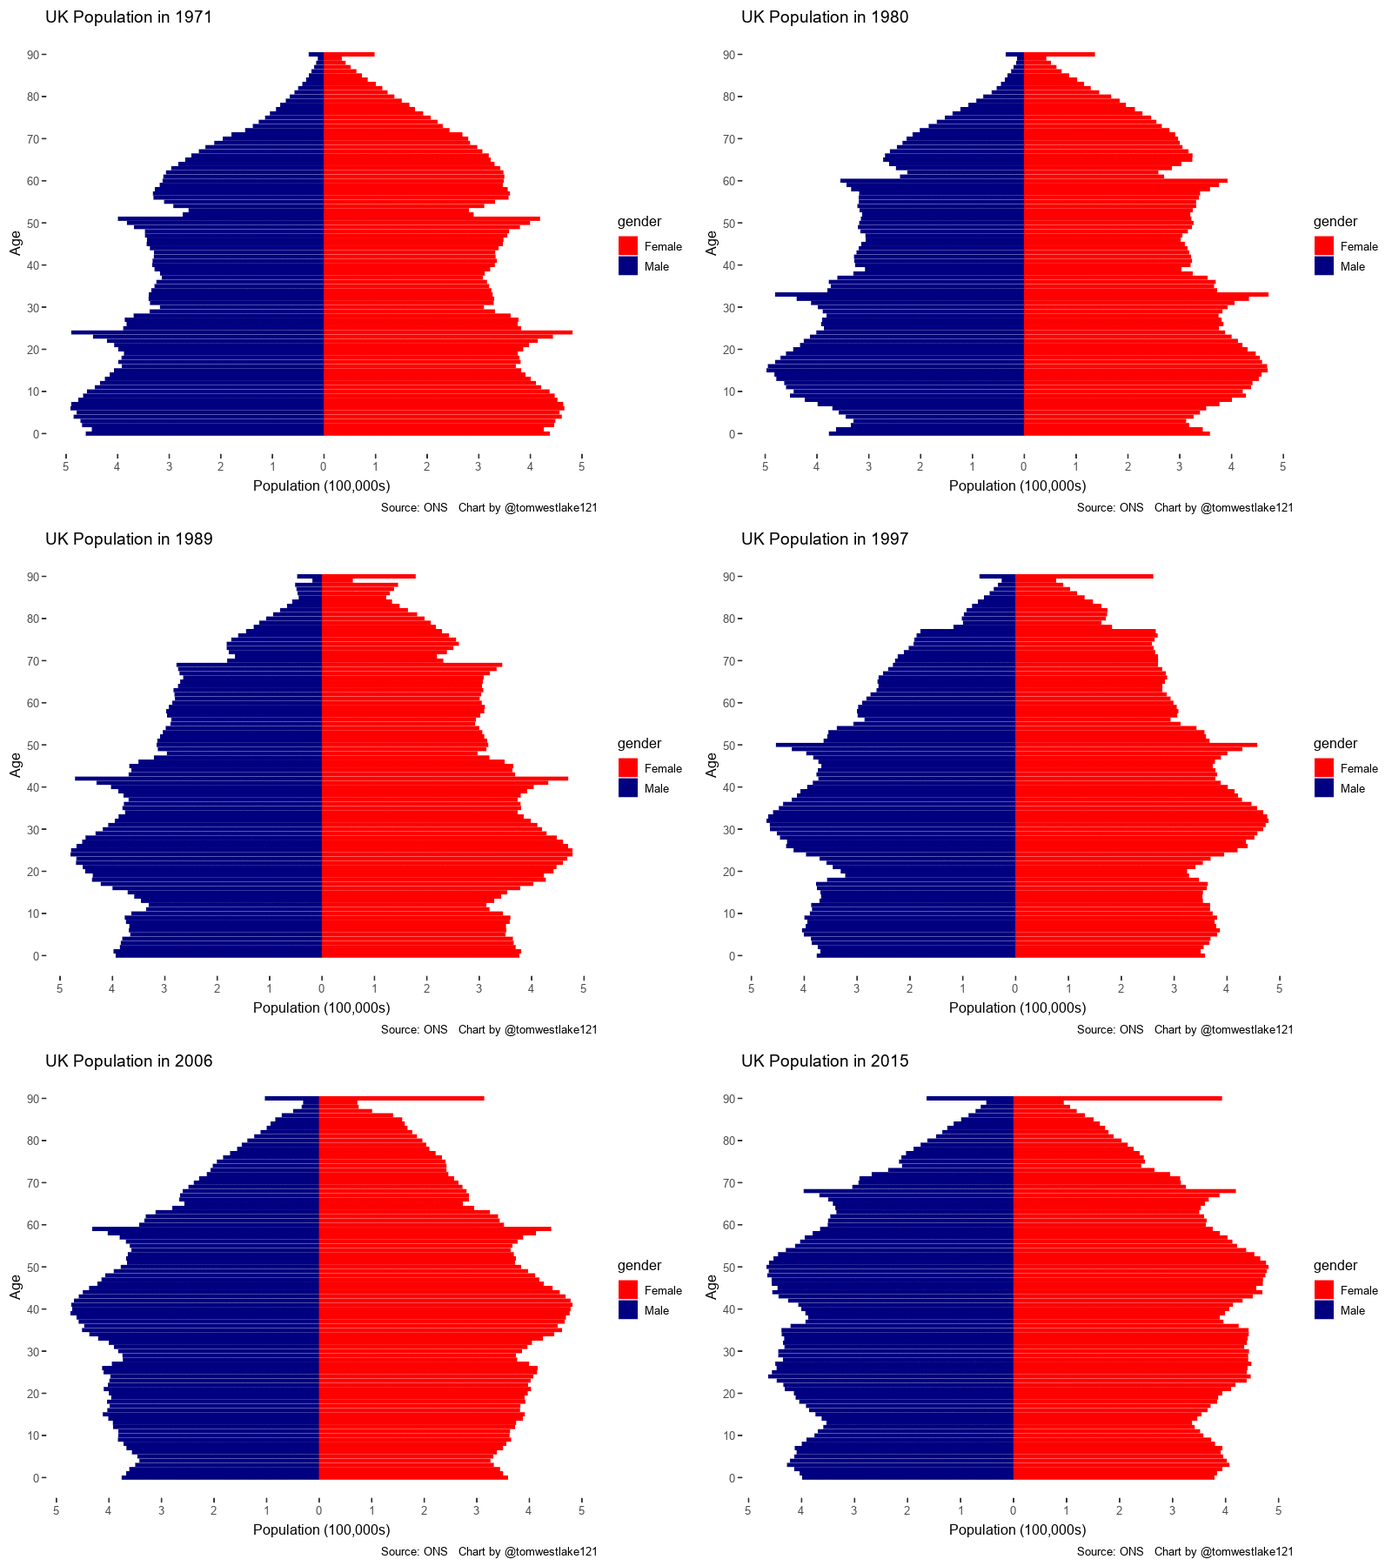
On my journey to creating my animated Premier League table in my previous post, I noticed a lot of examples for creating gifs using the magick package. The gist behind the majority of these examples was to create a sequence of snapshots which could be combined together to create animations. Whilst not quite as seamless as gganimate, it appears to be much more versatile. So I thought I would try and make one.
Animated Premier League Table

Animated Premier League Table

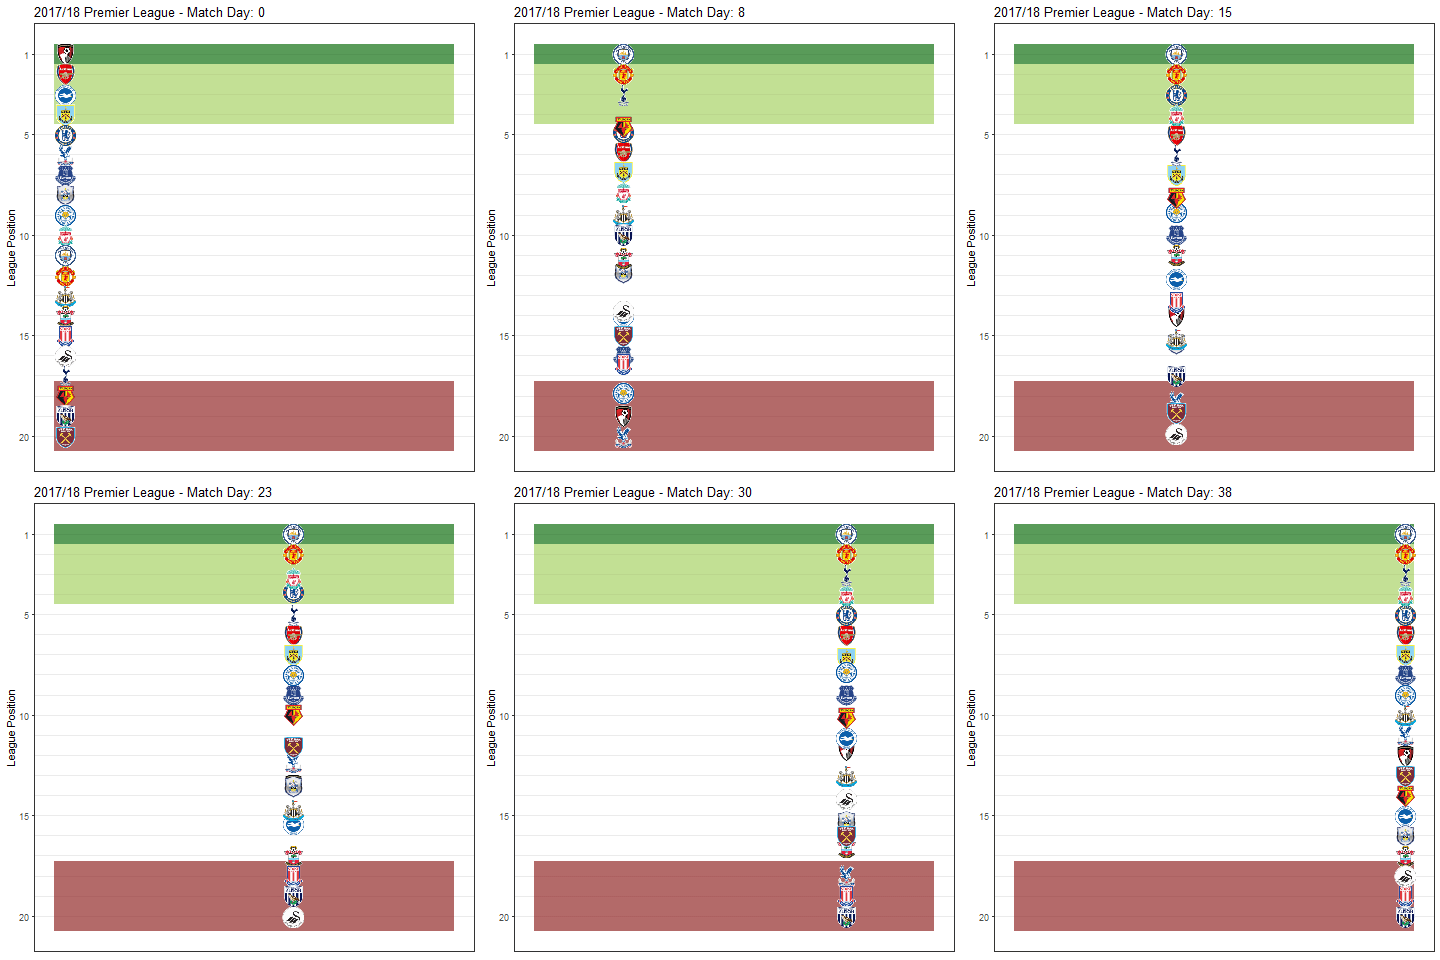
For my inaugural blog post I decided I would step into the world of animated graphics for the first time. I was inspired by the presentation that Thomas Lin Pedersen gave at the useR! conference on gganimate and was motivated to create my very first gif. I rooted around for ideas and decided upon creating an animated table of the Premier League for the last season, with the clubs being depicted by their crests.